SPTrans network vulnerability and resilience
Modeled São Paulo's (Brazil) public transit network (SPTrans) as a graph and measured which stops are topologically critical and how resilient the network is to random failures and targeted attacks
overview
Problem
Section titled “Problem”In a network moving ~7.1 million passengers per working day, which stops actually determine how the system holds together? Importance depends on the structure of the whole network, not on operational intuition.
methodology
Methodology
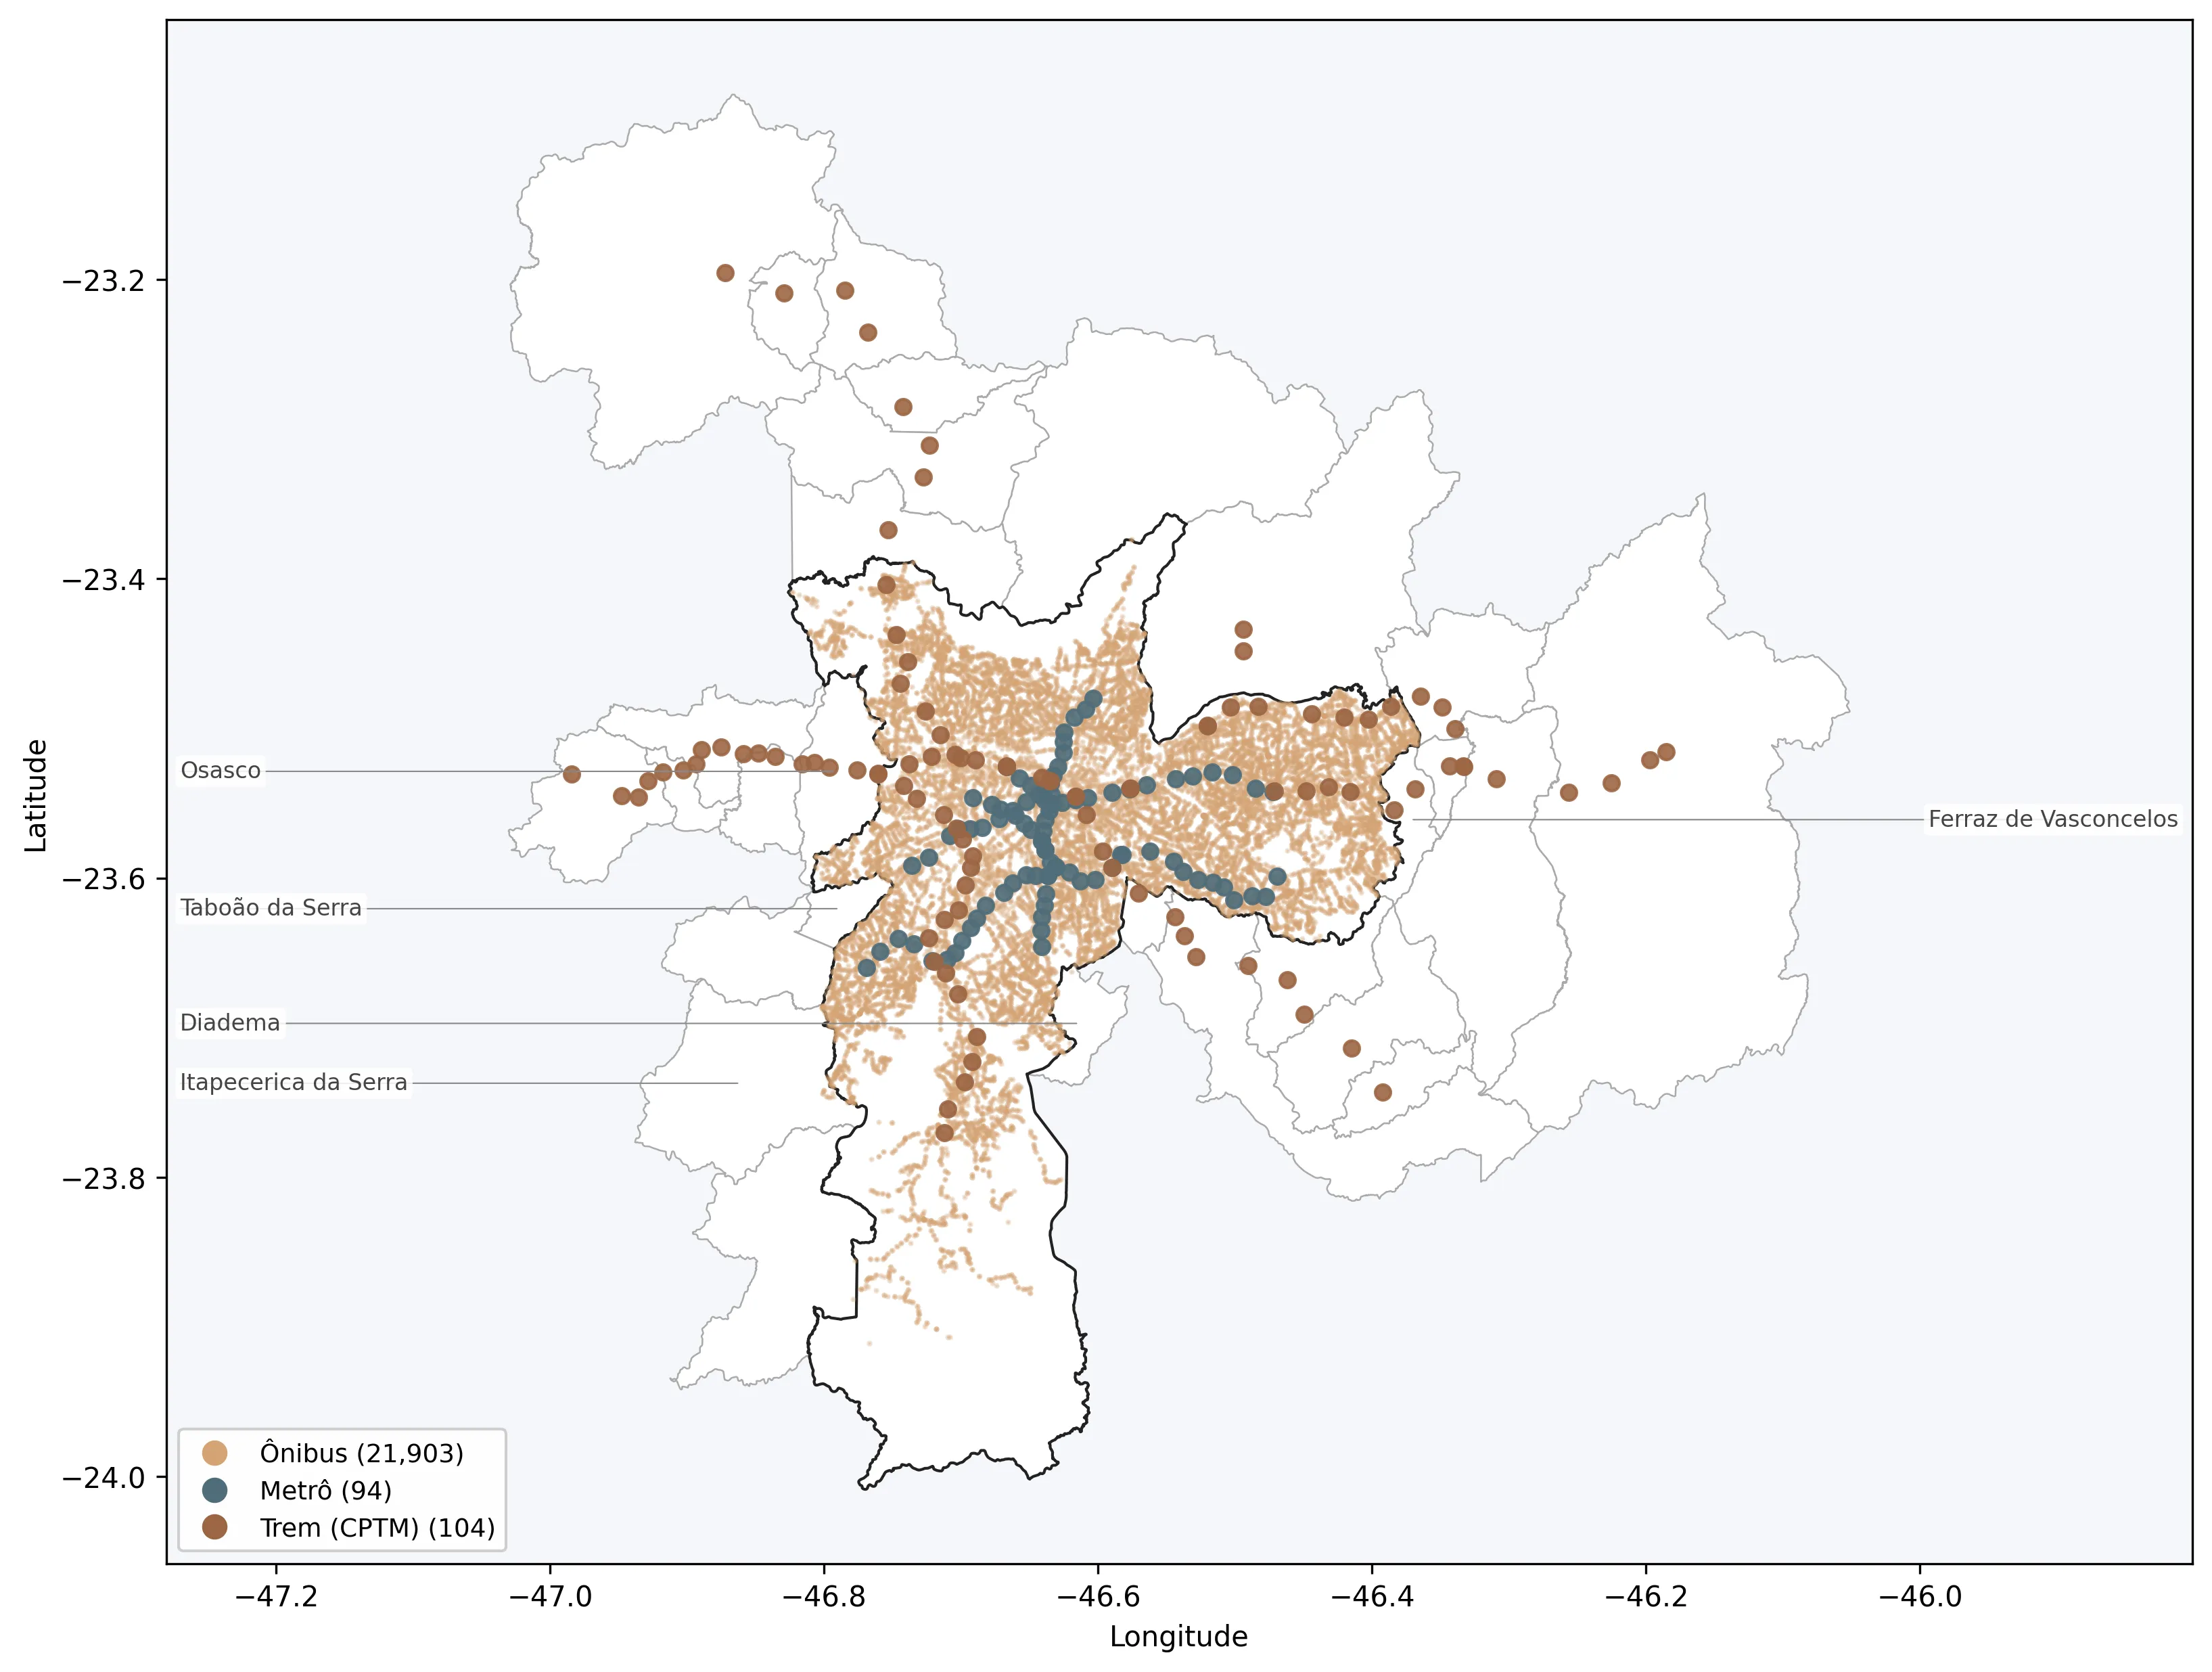
Section titled “Methodology”Data: static GTFS feed from SPTrans (March 2026) + IBGE municipal boundaries.

Graph modeling
Section titled “Graph modeling”L-space graph in NetworkX.
Creation of Intermodal edges
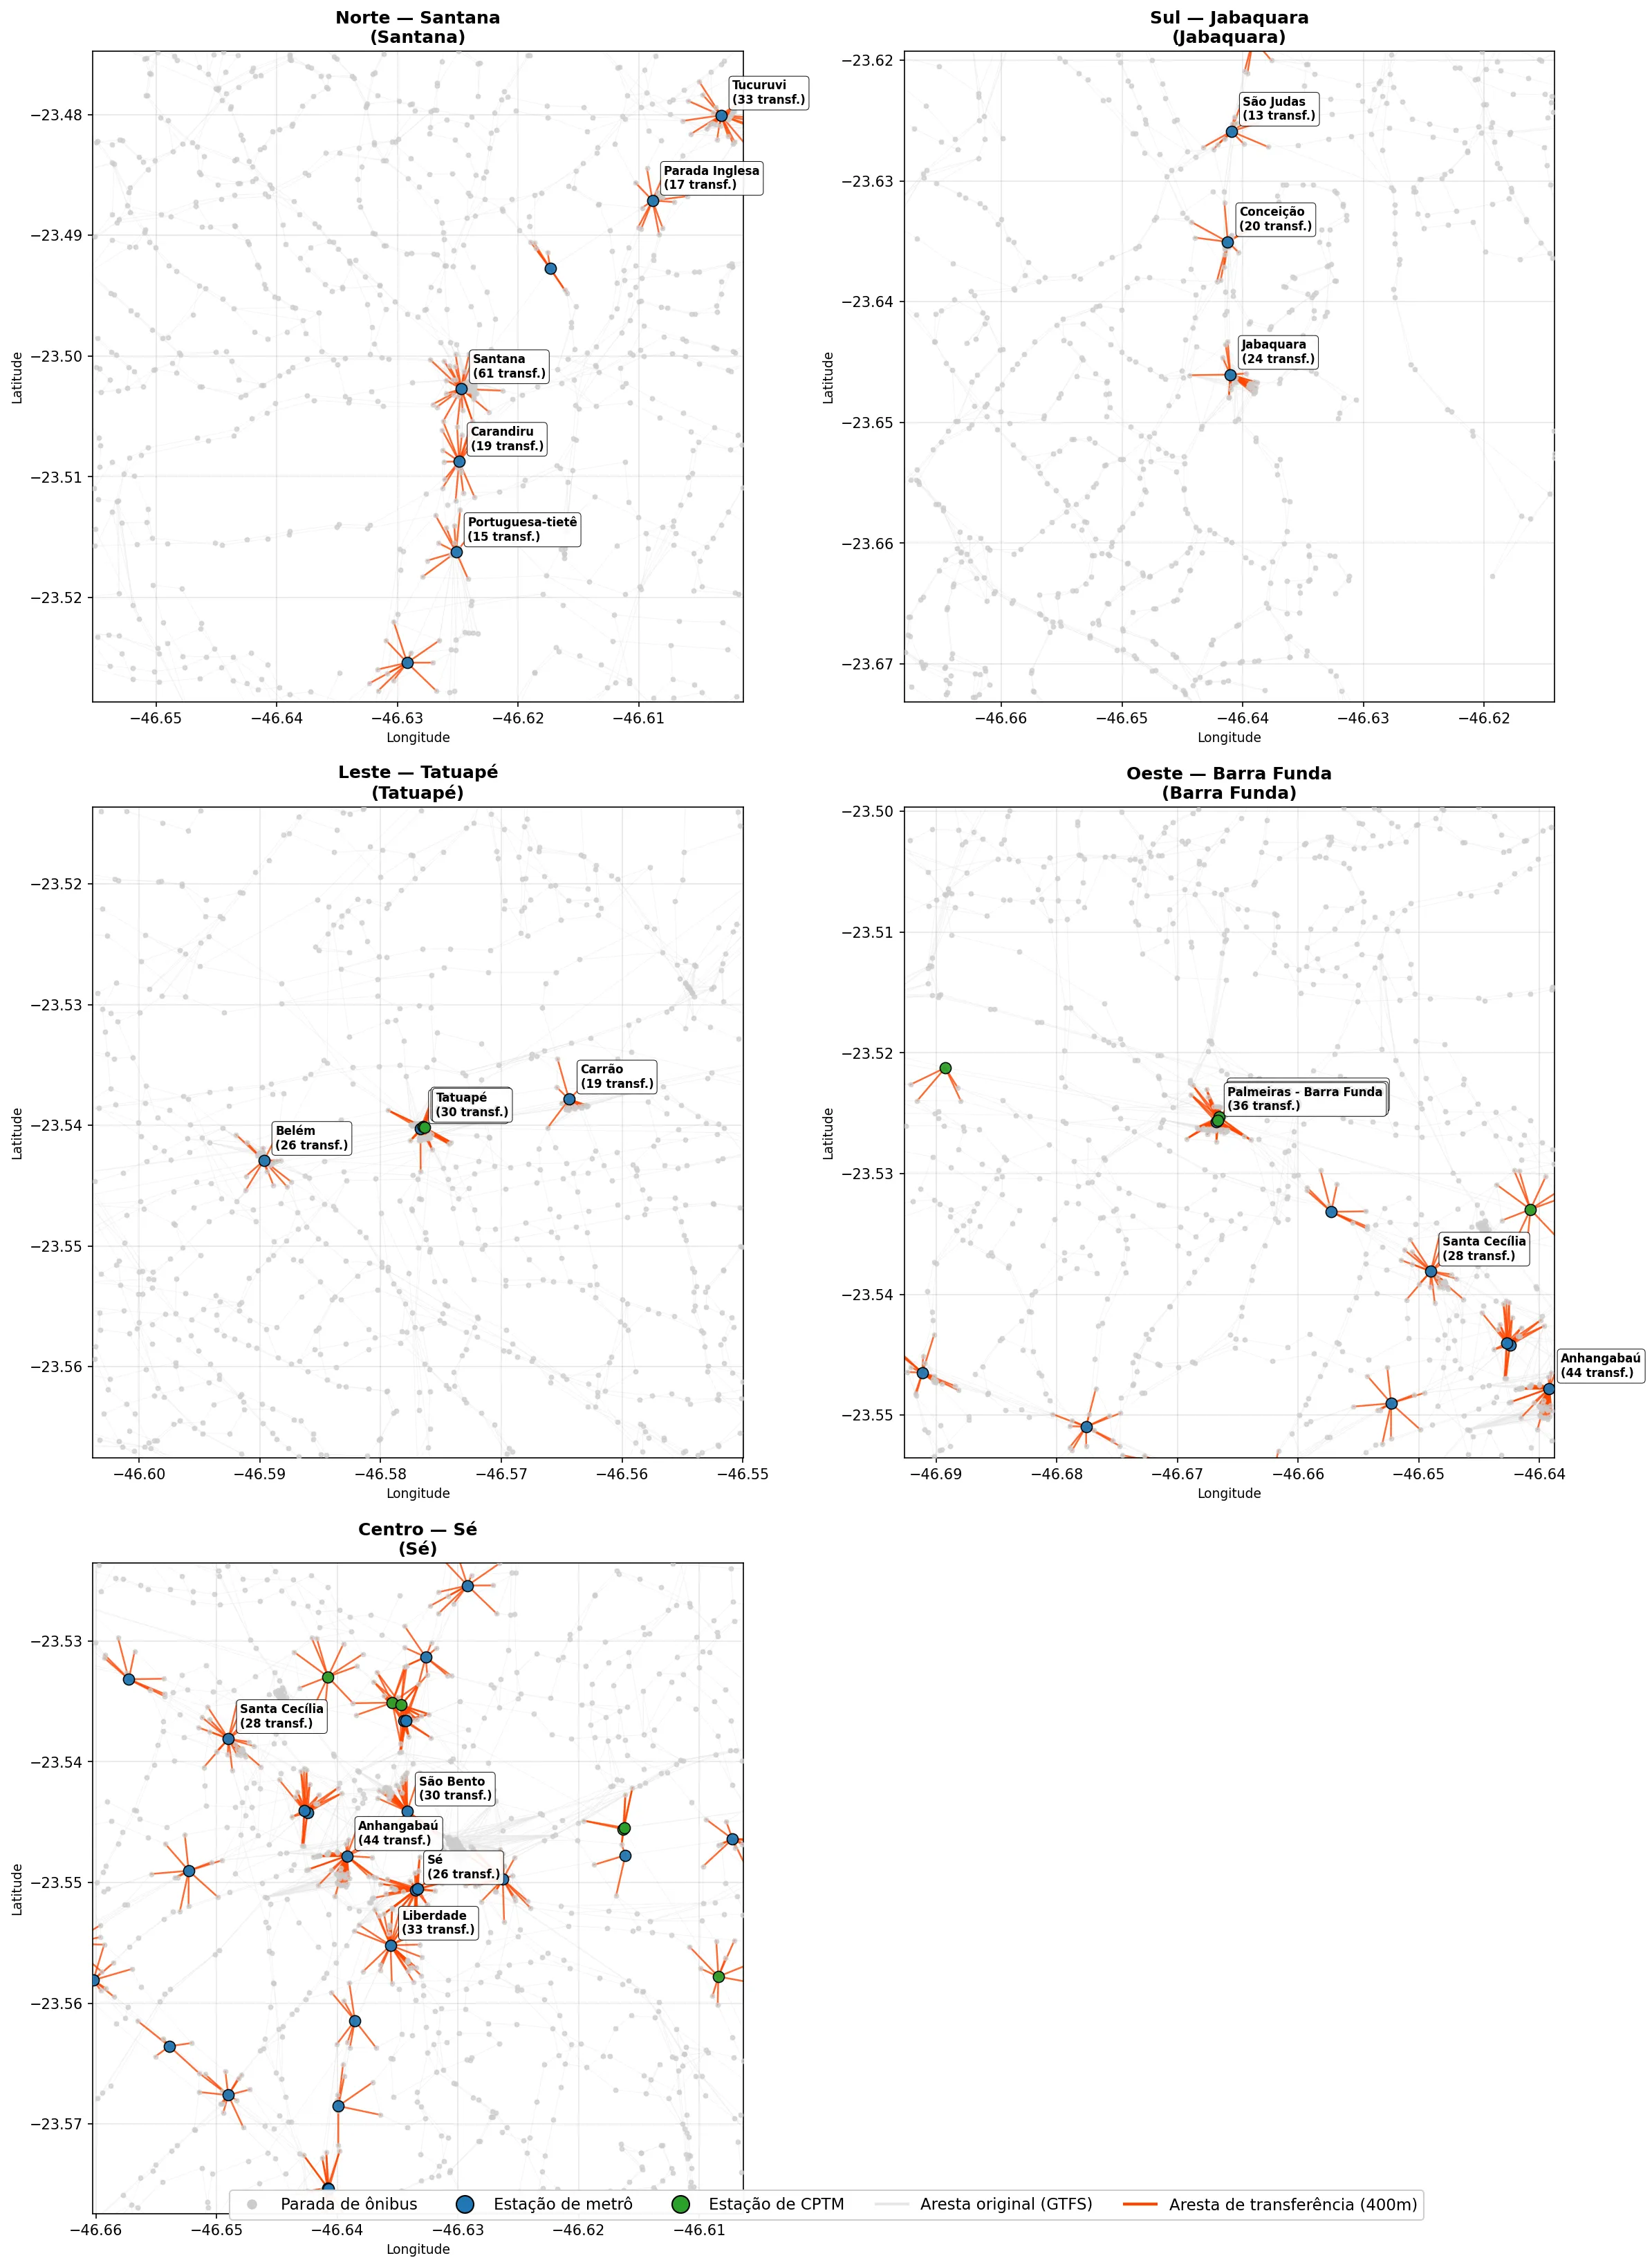
Section titled “Creation of Intermodal edges”Intermodal integration of Metrô/CPTM via 400 m transfer edges (scipy.spatial.cKDTree)
results
Analysis
Section titled “Analysis”-
Vulnerability: degree, betweenness (approximated) and closeness centrality.
-
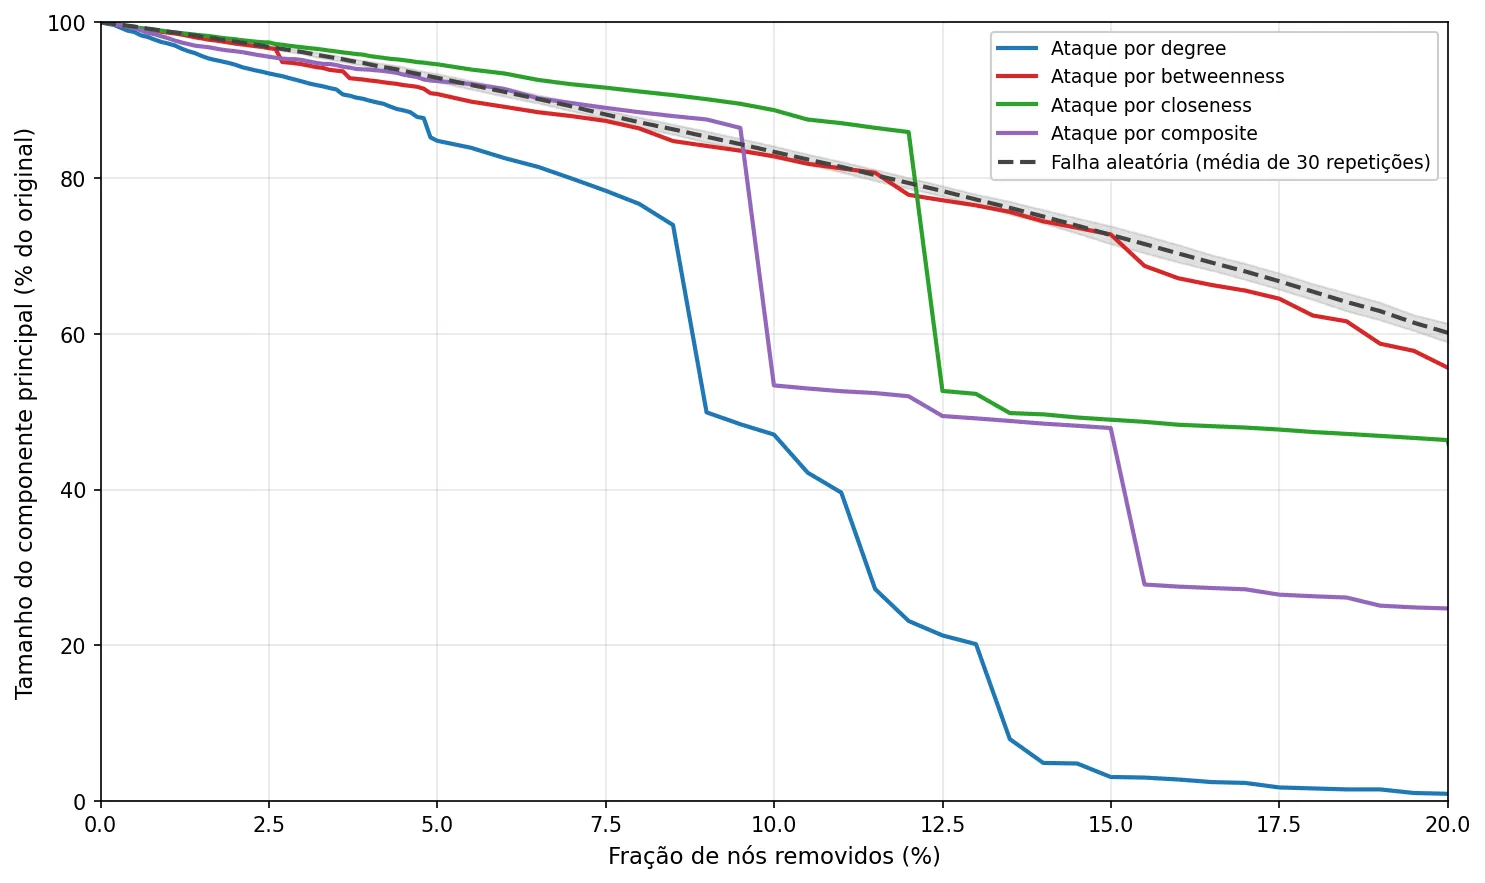
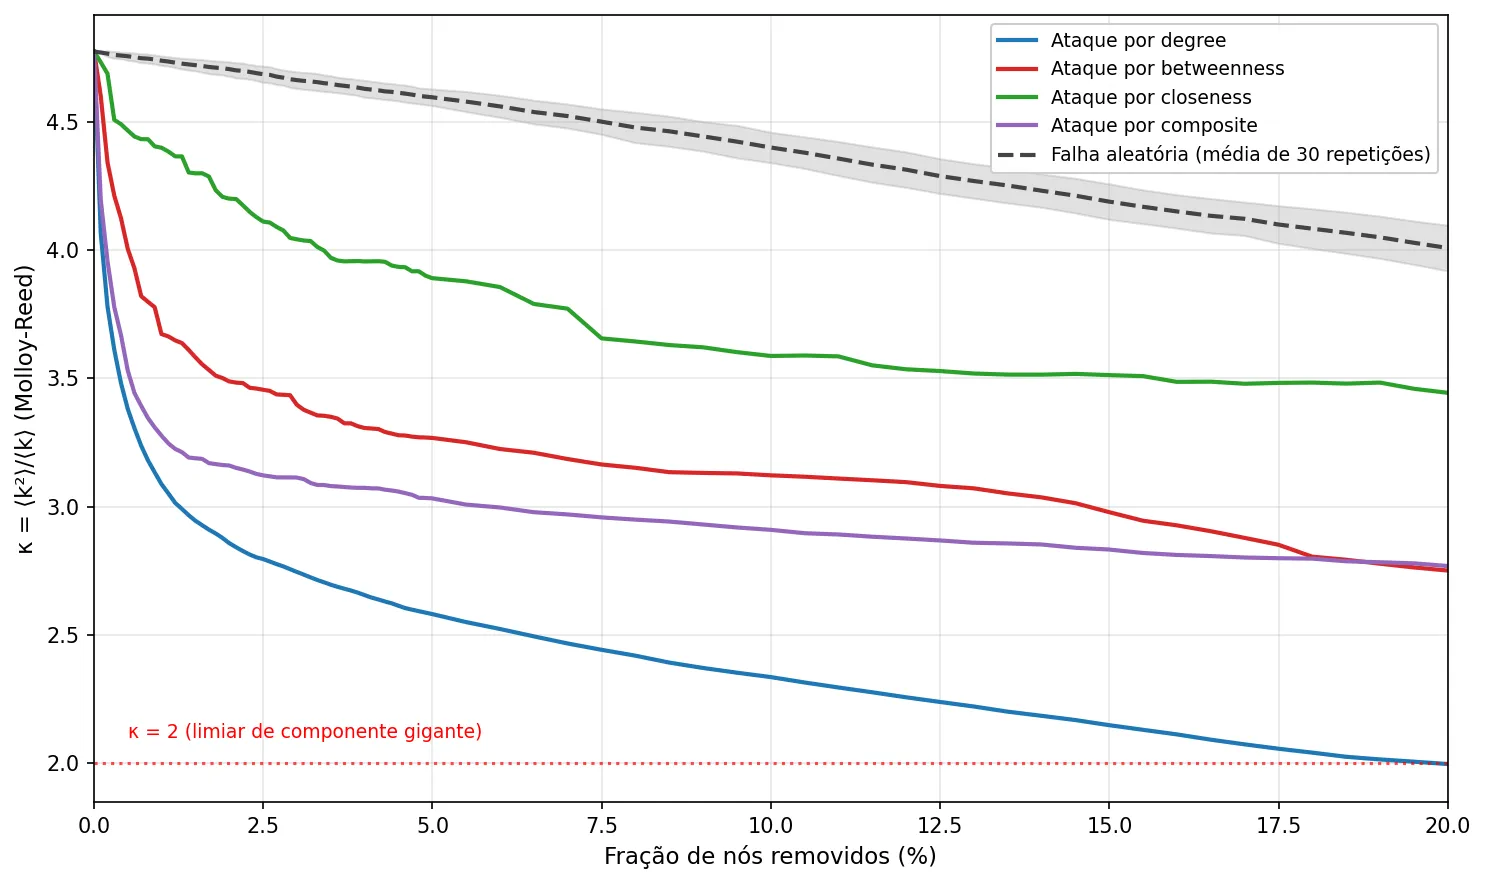
Resilience: sequential node removal (4 targeted attacks + random failure, 30 runs), tracking the largest connected component (LCC) and the Molloy-Reed κ parameter.
Key findings
Section titled “Key findings”- Brás station is the network’s articulation node: ~38% of shortest paths with only 7 direct neighbors.
- Confirms the Albert-Jeong-Barabási paradigm: tolerant to random failures (removing 20% at random keeps 62% of the main component) but fragile to targeted attacks (removing by degree halves the main component with just 9% of nodes).
- 48 CPTM stations on metropolitan branches stay disconnected: an institutional limit.
stack